
The Nokia 1100 was a great phone. Reliable, indestructible, did exactly what it said on the box. Then the iPhone arrived and the whole category was retired in five years.
Not because Nokia stopped working. Because what a phone was had changed.
Data analytics is at that moment now.
Dashboards are charts waiting to be read
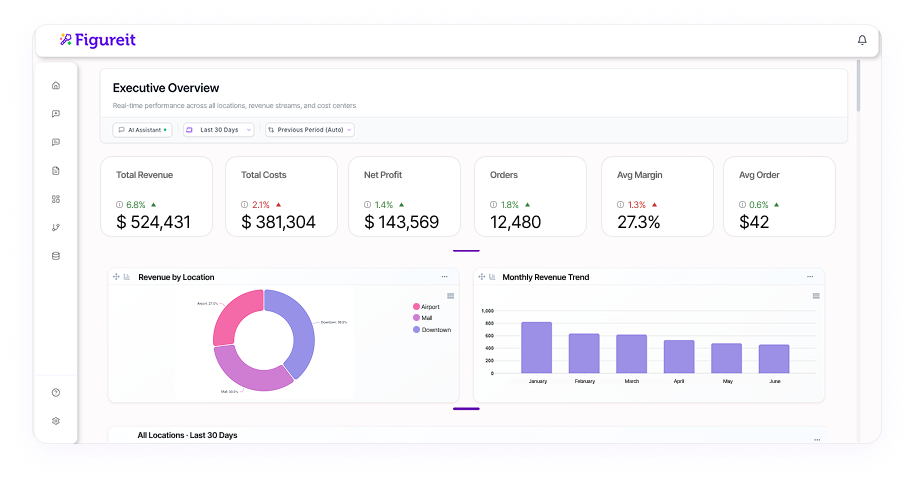
For two decades the unit of value in business analytics has been the dashboard. A grid of charts that an operator is supposed to glance at, interpret, and act on.
The dashboard sits there. It is static. It is sad. It cannot tell you anything that wasn't pre-decided by whoever built it three months ago.
If you want a new view? You file a ticket with a BI developer. You wait. You explain. You wait some more. You get something close but not quite. You compromise. You move on. The dashboard ages. The questions you wanted to ask never made it into a chart, so they never got answered.
Everyone in the room knows this. Operators stop asking. Analysts stop building. The dashboard becomes a museum exhibit of last quarter's interests.
Insights waiting to be read
The new unit of value isn't a chart waiting to be read. It is an insight waiting to be read.
AI doesn't just render the picture — it studies the picture for you. It surfaces what matters. It flags what changed. It explains why. The operator no longer has to scan twelve charts hoping the relevant pattern is one they recognize. The relevant pattern is already at the top of the page, in words.
This is the Nokia-to-iPhone moment for analytics. The old objects still exist. They have just stopped being the point.
Generate dashboards by talking
The visual is still useful. Sometimes you want the chart.
So we let you make one — by talking.
You describe what you want to see, in your own language, and the dashboard materializes. No ticket. No BI developer. No three-week wait. No fear of asking for the wrong thing. If it isn't right, you say so, and it changes.
This is the part that altered the world: building a dashboard used to be a project. Now it is a sentence.
As simple as it gets
The old generation built dashboards and called it analytics. The new generation lets AI read the data, surface the insight, and assemble the view — on demand, in your language, the moment you want it.
Dashboards are not gone. They are no longer the gate. They are the byproduct.
This is what Figureit is built for. As simple as it gets.